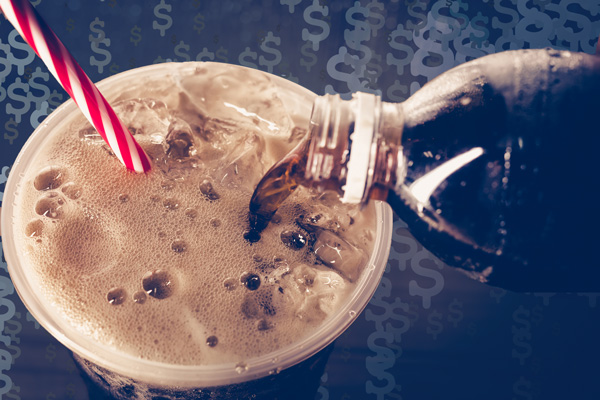
Last November, voters in Oregon and Washington State cast their ballots on whether to prevent cities and counties from enacting taxes on sodas and other sweetened beverages. Oregon’s measure failed and Washington’s passed, but the fact that voters in multiple states were considering soda taxes is a sign of how far the idea has come. Local communities first started debating a tax on sugary drinks in the early 2000s as a strategy to improve health and prevent obesity, but no U.S. city actually implemented one until 2015, when a voter-approved measure in Berkeley, California, went into effect. Since then, eight cities and the Navajo Nation (which spans portions of Arizona, Utah, and New Mexico) have enacted some form of sugar-sweetened beverage (SSB) tax. Also, soda taxes have become quite popular internationally, and they are now in place in numerous countries, including Australia, France, Ireland, Mexico, and the United Kingdom.
Because SSB taxes are relatively new in the United States, it's only recently become possible to gather data on them and assess their impacts. Early proponents argued that the taxes would raise prices by the amount of the tax, curb consumption, and ultimately reduce the incidence of diet-related chronic diseases such as obesity and type II diabetes. Proponents also framed the taxes as potential sources of new revenue to support popular programs in the community, such as public education and libraries. Opponents expressed concern that the taxes could disproportionately affect low-income households and hurt local businesses if consumers choose to buy beverages elsewhere.
Evidence of what’s actually happening in the United States has largely come from a few studies in Berkeley and Philadelphia. However, despite broad interest in the long-term impacts of SSB taxes on children’s consumption and health, the existing studies only measured impacts on adults—and primarily only within the first few months of implementation. In addition, studies conducted on SSB taxes in other countries, such as Mexico, lack comparison communities, making it difficult to establish a causal link between the tax and changes in consumption. Yet the research published through early 2019 has encouraged supporters of SSB taxes. One study found that the Berkeley tax reduced consumption in large, low-income neighborhoods with high proportions of Latino and African American adults. Another study found that in Philadelphia, adults were less likely to be daily consumers of regular soda or energy drinks two months after their tax went into effect, but the evidence around other beverages was less clear.
We are a multidisciplinary team of economists and researchers from Mathematica, the University of Iowa, and Cornell University, funded by the Robert Wood Johnson Foundation, who sought to build on this growing body of knowledge. We did so by collecting and analyzing data over a longer period (almost a year after implementation) from two cities with beverage taxes, Philadelphia and Oakland. Our team’s first two papers focused on Philadelphia and appeared as National Bureau of Economic Research working papers last fall.
Our findings indicate that the tax is changing the behavior of retailers and some groups of consumers, but it has not reduced overall consumption among children or adults. To fully understand the tax’s impact on consumption and health, researchers will need to study the impacts in Philadelphia beyond the first year and in other cities with different populations, geographies, and policy designs. It will be important to track whether changes in consumer behavior persist from childhood to adulthood and result in long-term health benefits. Nonetheless, our research provides several new insights about the impacts of SSB taxes in a U.S. city.
Retailers in Philadelphia passed the tax’s full amount onto consumers and changed what they stocked.
Philadelphia levied a tax on distributors of 1.5 cents per ounce on a range of sweetened beverages, including regular and diet sodas. Early research from Berkeley, California, and Boulder, Colorado, suggests that retailers didn’t pass the full amount of the tax onto consumers in those communities. In contrast, we found that in Philadelphia, the tax was fully passed onto consumers. For example, the tax increased the average price of a 20-ounce bottle of regular soda by 36 cents (22.5 percent), from $1.60 to $1.96. We also found that retailers responded to the tax by making untaxed beverages, such as bottled water, more available and making sweetened beverages less available. These findings are consistent with an earlier study that focused only on retailers in the Philadelphia airport, where, because the airport straddles the city border, the tax applies in some terminals and not others.
The tax did not reduce average consumption, except for some specific groups.
We found that Philadelphia’s tax didn’t change the average consumption of sweetened beverages among adults or children overall, but it did result in declines for some groups with previously high levels of consumption that were at risk of developing health problems because of their diets. For example, children who were consuming roughly the equivalent of a 20-ounce bottle of regular soda per day experienced a 22 percent reduction in their intake of added sugars from beverages. African American adults and children, two groups who consumed relatively high amounts of taxed beverages before the tax, also saw consumption decline. These findings are meaningful for policymakers because the tax appears to be reducing consumption among groups who are at higher risk of developing health conditions because of their diets. We suspect that part of the reason for the decline is related to their previously high levels of consumption and the budget implications of continuing to buy with the same frequency after prices rose. Those with high consumption are also simply capable of greater decreases in consumption, so we’re more likely to see them make notable improvements.
Some Philadelphia residents are shopping outside the city more often.
The data also suggest that Philadelphia residents who were already shopping outside the city are taking more of their business across the city border to untaxed stores. Even before the tax went into effect, roughly 17 percent of consumers at stores outside of the city were Philadelphia residents, and more than a quarter of these Philadelphia residents shopped outside of the city at least once a week. After the tax, Philadelphia residents shopping outside the city purchased more taxed beverages and were more likely to say that a store outside of Philadelphia was their usual source for beverage purchases. This change is consistent with the price increases observed at Philadelphia stores—the price increases in the city gave residents an incentive to shop across the border. Although we found that, on average, businesses passed on the full amount of the tax to consumers, stores near the city border absorbed some of the tax’s cost themselves, likely because they were trying to compete with untaxed stores just outside the city.
Implications: Differences in geography and policy design could affect an SSB tax’s efficacy.
Cross-border shopping might explain why there haven’t been large declines in the overall consumption of taxed beverages for children and adults, and it could dampen the potential improvements to public health. If consumers are still buying sweetened beverages but simply shifting where they make their purchases, policymakers might wish to respond by enacting laws that apply across a broader geographic area, such as the state level. State taxes covering areas larger than individual cities could reduce options for cross-border shopping and reduce consumption. Although Arizona, California, Michigan, and Washington State have preemption laws that prohibit new local SSB taxes, the laws do not prohibit state-level taxes.
It’s also possible that something about the design of Philadelphia’s beverage tax explains why we haven’t seen widespread declines in consumption across all groups and sweetened beverages. For example, Philadelphia is the only U.S. city to tax noncaloric beverages (such as diet soda), which could have discouraged consumers from turning to a possible substitute for sugary drinks. The amount of the tax could also be too small to nudge consumers to change what they drink. So far, city SSB taxes have ranged from one cent to two cents per ounce. Perhaps consumers would reduce consumption if they faced a higher price point. In fact, a recent working paper estimates that the optimal SSB tax is likely larger than 1.5 cents per ounce. Of course, a larger tax could also lead to more cross-border shopping. When policymakers consider a beverage tax, they should keep in mind these design details and how they could affect achievement of the tax’s goals.
Upcoming data from our study of the beverage tax in Oakland will shed light on how differences in policy design and geography affect the tax’s impact. In contrast with Philadelphia, Oakland’s tax focused exclusively on drinks with added sugars and did not tax those with noncaloric sweeteners. In addition, Oakland’s tax is smaller, at 1 cent per ounce compared with Philadelphia’s 1.5 cents per ounce. It’s also plausible that accessibility of cross-border shopping will differ given that Oakland is smaller than Philadelphia, but it borders or is closer to other cities with SSB taxes (San Francisco, Berkeley, and Albany, California).
Driven by interest in reduced consumption and improved health for their communities, more cities have sought to adopt local SSB taxes in the past few years. Now is the perfect time to examine the impacts of the taxes and how the details of the policies can influence their efficacy.


